Registered S3 method overwritten by 'GGally':
  method from
  +.gg   ggplot2
Code
sign_scores
3 Concusions
I cannot quite reproduce the results from the paper. In the paper the signatures from Avey et al. (2017), are very helpful to predict the fold changes, but this is not quite the case here. Maybe I am not using the best scoring function.
4 Results
Code
task_meta <-list(task_11 =list(name ="task_11",header ="## Task 1.1",description ="Rank the individuals by IgG antibody levels against pertussis toxin (PT) that we detect in plasma 14 days post booster vaccinations." ),task_12 =list(name ="task_12",header ="## Task 1.2",description ="Rank the individuals by fold change of IgG antibody levels against pertussis toxin (PT) that we detect in plasma 14 days post booster vaccinations compared to titer values at day 0." ))
Rank the individuals by IgG antibody levels against pertussis toxin (PT) that we detect in plasma 14 days post booster vaccinations.
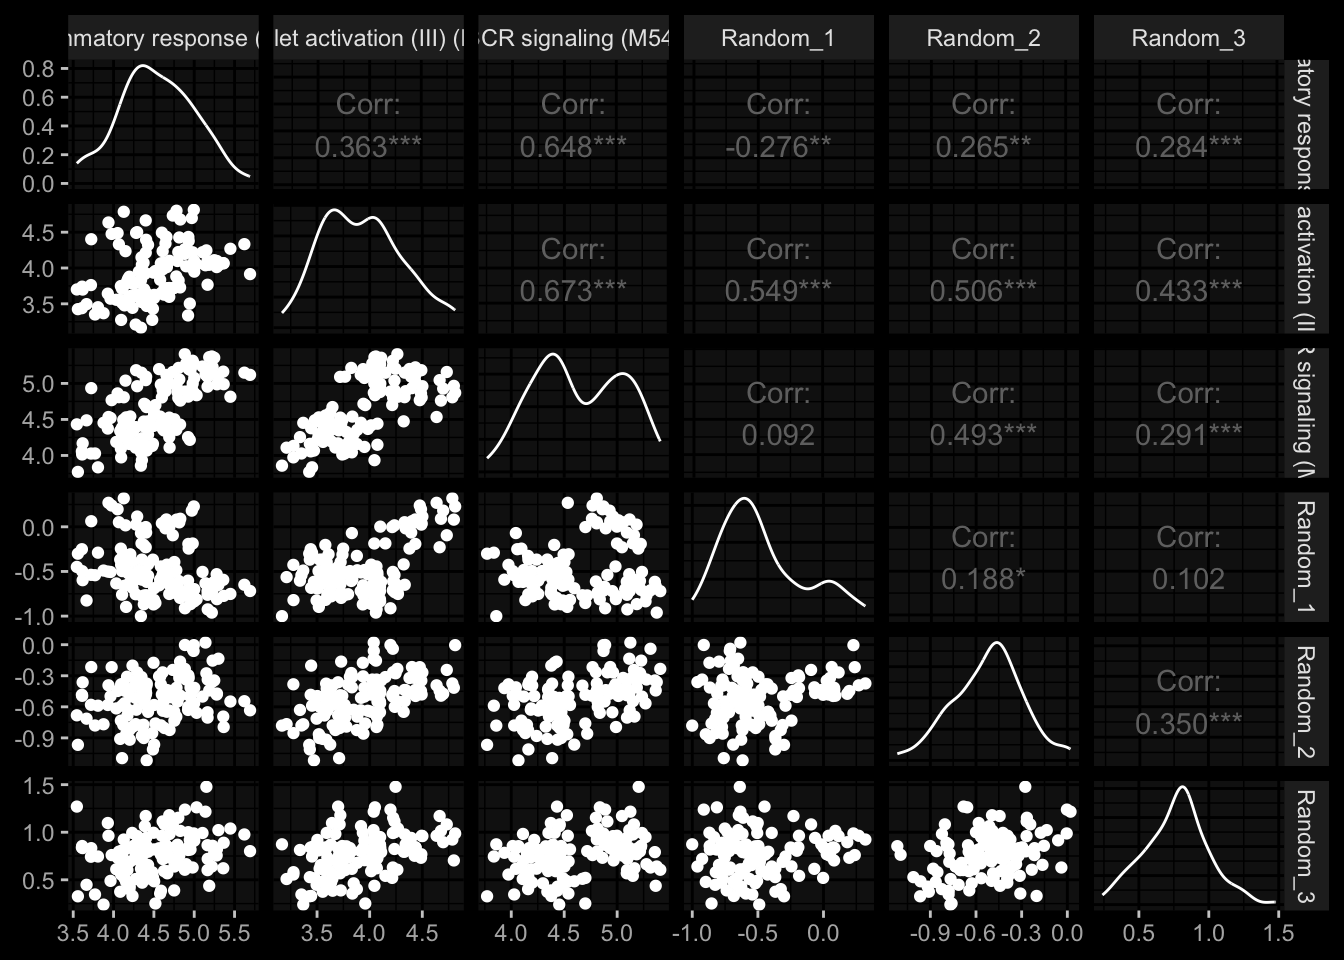
4.1.1 inflammatory response (M33)
dataset
srho_baseline
srho_signature
srho_pval_signature
2021_dataset
0.60
0.06
0.388
2022_dataset
0.44
0.42
0.034
4.1.2 platelet activation (III) (M42)
dataset
srho_baseline
srho_signature
srho_pval_signature
2021_dataset
0.60
0.02
0.441
2022_dataset
0.44
-0.03
0.541
4.1.3 BCR signaling (M54)
dataset
srho_baseline
srho_signature
srho_pval_signature
2021_dataset
0.60
-0.14
0.785
2022_dataset
0.44
-0.08
0.656
4.1.4 Random_1
dataset
srho_baseline
srho_signature
srho_pval_signature
2021_dataset
0.60
0.00
0.513
2022_dataset
0.44
-0.11
0.694
4.1.5 Random_2
dataset
srho_baseline
srho_signature
srho_pval_signature
2021_dataset
0.60
-0.10
0.729
2022_dataset
0.44
-0.36
0.937
4.1.6 Random_3
dataset
srho_baseline
srho_signature
srho_pval_signature
2021_dataset
0.60
0.07
0.318
2022_dataset
0.44
-0.12
0.709
4.2 Task 1.2
Rank the individuals by fold change of IgG antibody levels against pertussis toxin (PT) that we detect in plasma 14 days post booster vaccinations compared to titer values at day 0.
4.2.1 inflammatory response (M33)
dataset
srho_baseline
srho_signature
srho_pval_signature
2021_dataset
-0.71
0.11
0.266
2022_dataset
-0.89
-0.01
0.529
4.2.2 platelet activation (III) (M42)
dataset
srho_baseline
srho_signature
srho_pval_signature
2021_dataset
-0.71
0.03
0.436
2022_dataset
-0.89
0.27
0.143
4.2.3 BCR signaling (M54)
dataset
srho_baseline
srho_signature
srho_pval_signature
2021_dataset
-0.71
-0.19
0.848
2022_dataset
-0.89
0.01
0.472
4.2.4 Random_1
dataset
srho_baseline
srho_signature
srho_pval_signature
2021_dataset
-0.71
0.03
0.453
2022_dataset
-0.89
0.04
0.436
4.2.5 Random_2
dataset
srho_baseline
srho_signature
srho_pval_signature
2021_dataset
-0.71
0.09
0.309
2022_dataset
-0.89
-0.11
0.677
4.2.6 Random_3
dataset
srho_baseline
srho_signature
srho_pval_signature
2021_dataset
-0.71
-0.04
0.570
2022_dataset
-0.89
0.18
0.211
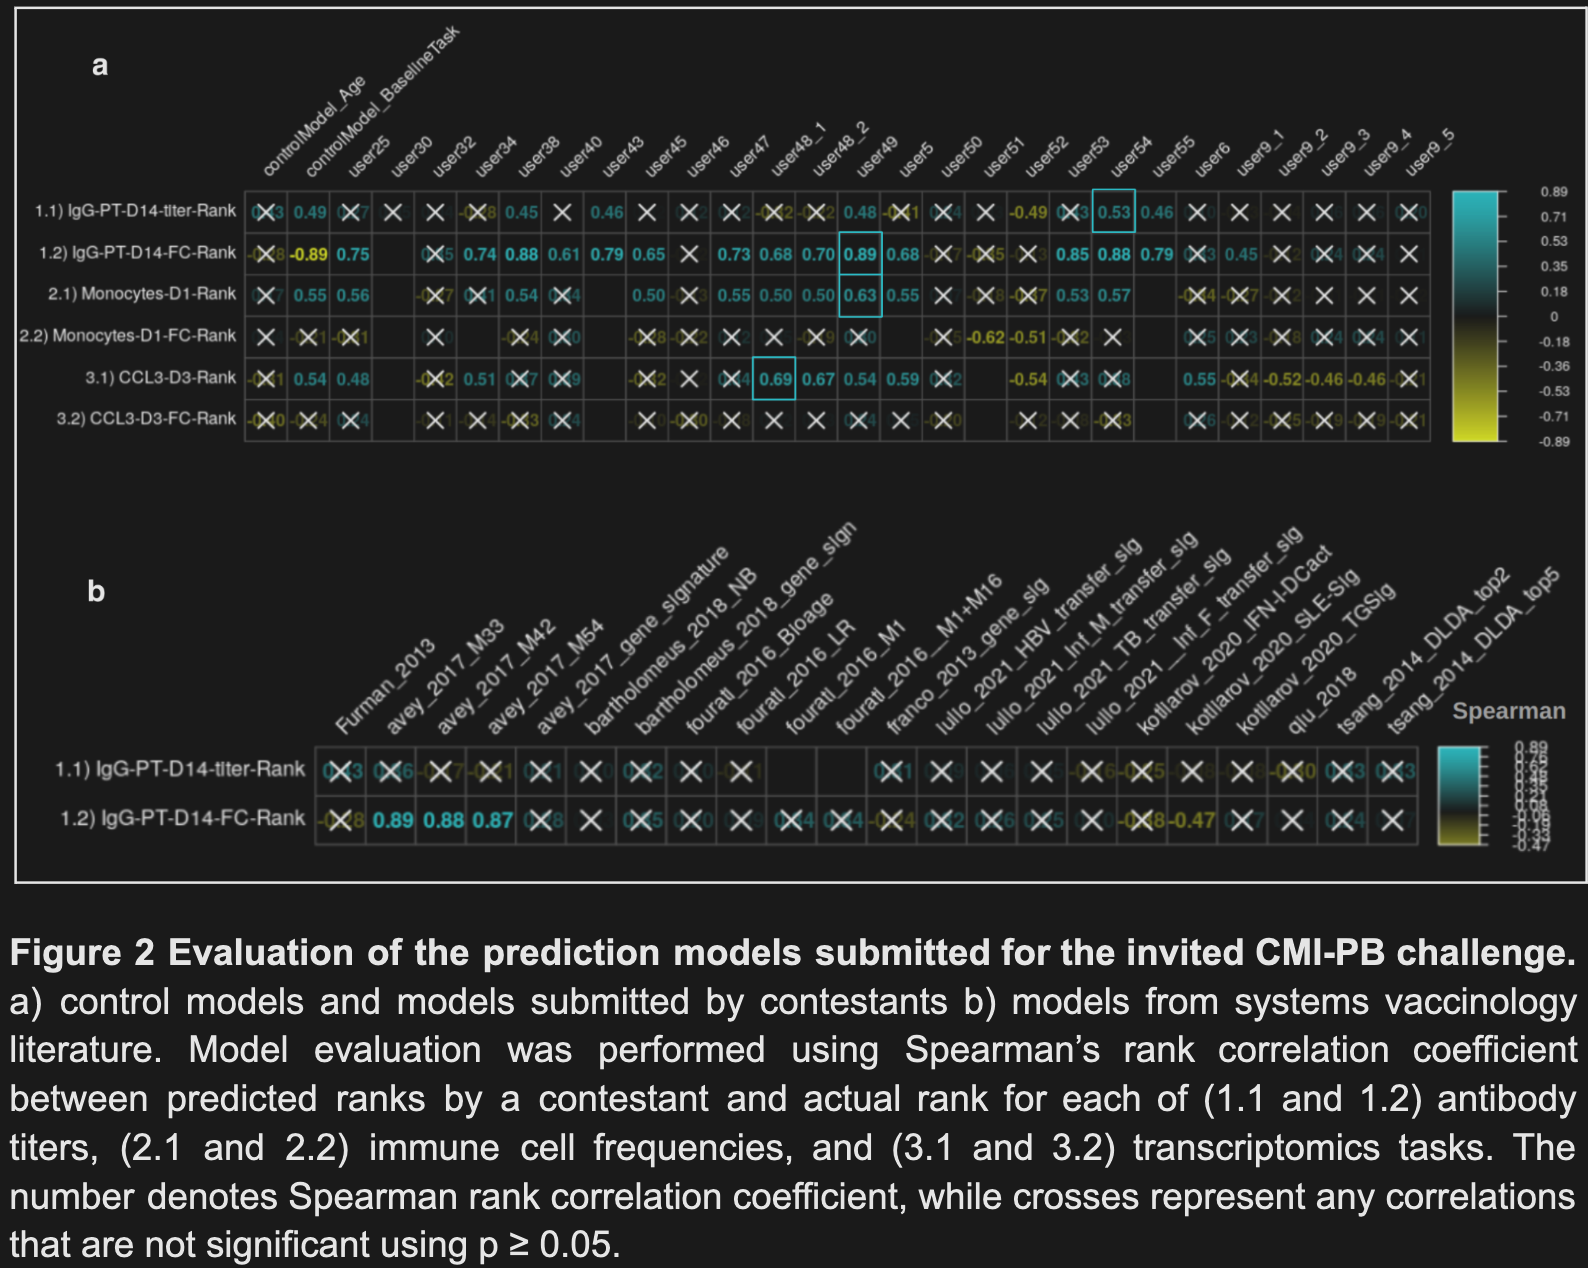
5 Previous Results
From: Shinde, P. et al. Putting computational models of immunity to the test - an invited challenge to predict B. pertussis vaccination outcomes. (2024) doi:10.1101/2024.09.04.611290.